hi,
Is there a way to use the raster feature to make an xray style orthoimage ?
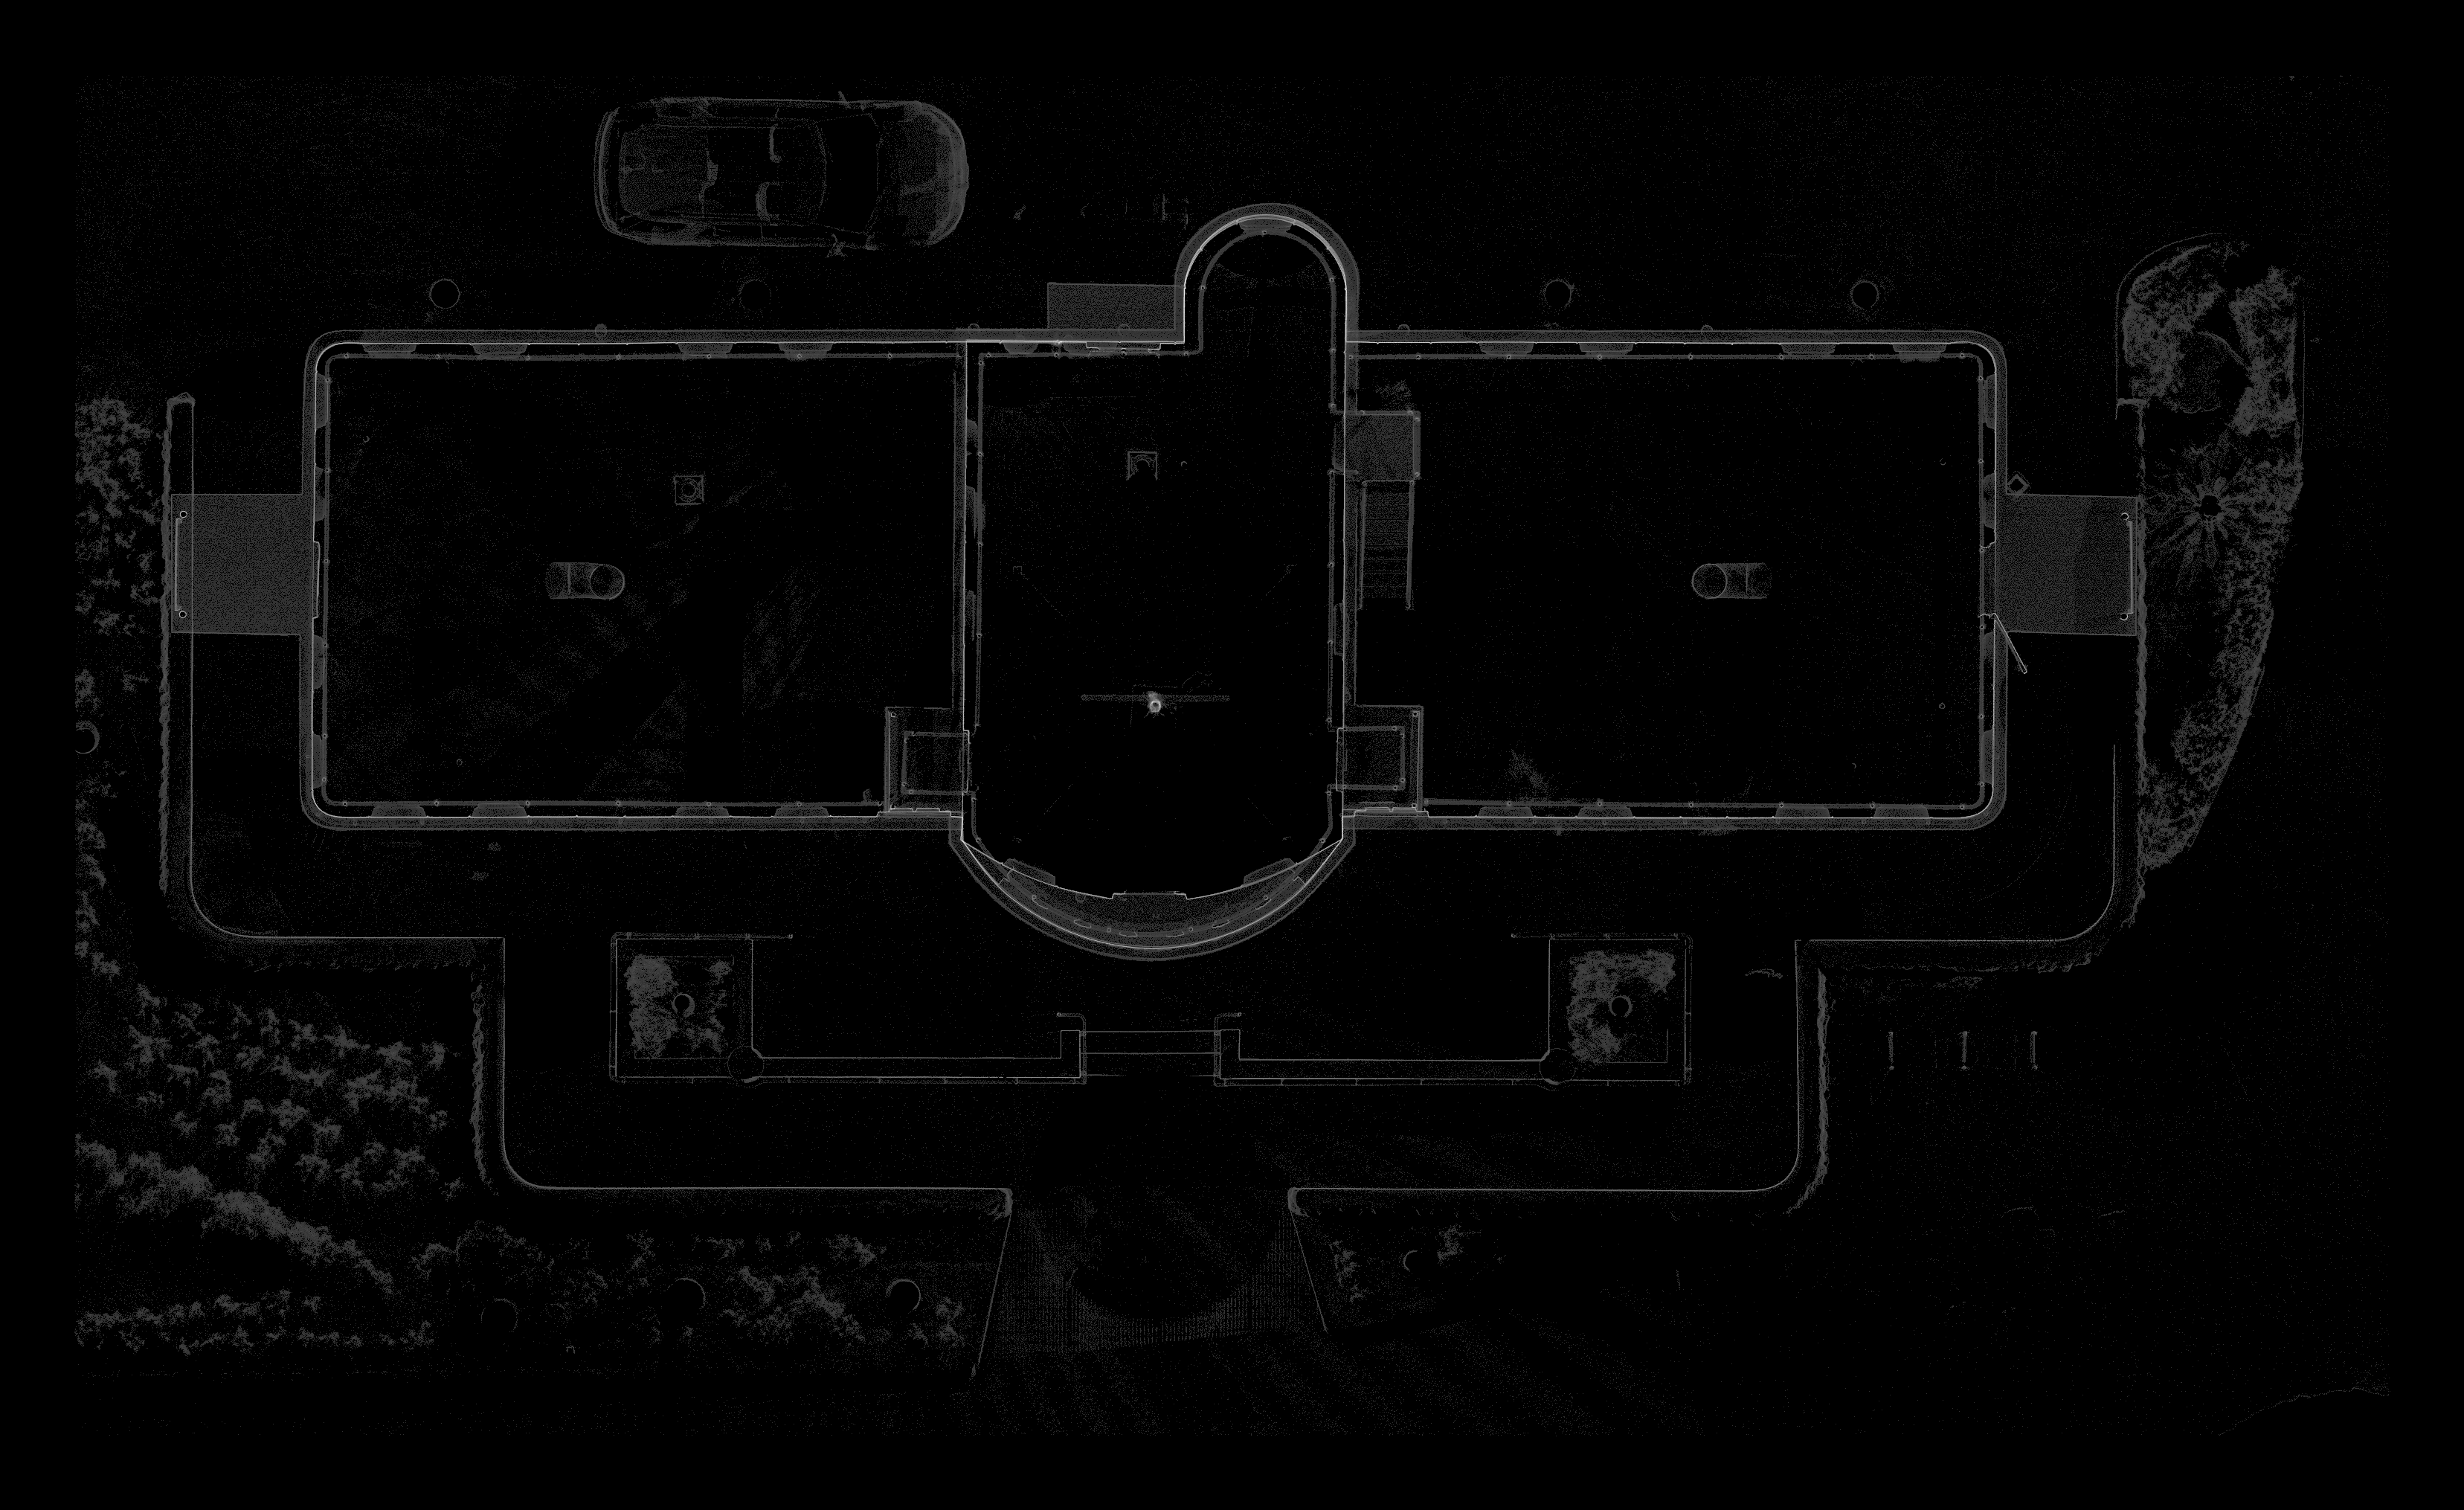
sample xray ortho here : https://quato.blob.core.windows.net/upl ... y_MVYG.png
To make an xray orthoimage you basically plot density, or point count over each xy cell - if more points occur above or below the xy cell, the score is higher and the xray image lighter.
For example a floorplan xray orthoimage would show walls as light areas, which makes for easy plan tracing to get a vector floorplan from the raster orthoimage.
I wonder if there is a way to achieve this, or would we need a fialog option "count" or "density" in addition to min/max/medium/average ??
[ ps. I notice in the code a mention of ccRasterGrid::PER_CELL_UNIQUE_COUNT_VALUE in ccRasterGrid.cpp.
This seems a similar computation : except we want a count of unique integer voxels above the xy cell occupied by points. This is better than raw point count, as it evens out the effect of higher density point counts closer to the scanner, lo some degree. nb, we want a count of occupied voxels, not the point or value count .. a voxel being a xyz cell above the xy cell of the raster ortho image ]
A related issue is .. if we want to get an orthimage of say a wall at an angle of 30deg from north, we would need to make a new sample pointcloud from that region, then use the raster feature .. there is no way to use the section tool local z axis / orientation ?
how to achieve xray style orthoimages
Re: how to achieve xray style orthoimages
in pseudocode : somethinhg like this :
Code: Select all
    case PER_CELL_UNIQUE_VOXEL_COUNT_VALUE:
    {
    	 // count num voxels for "xray" ortho-image

        size_t count = 0;
        for (size_t n = 1; n < cellPointVal.size(); ++n)
        {
            int prev = round(cellPointVal[n - 1] / gridStep);
            int curr = round(cellPointVal[n] / gridStep);
            if (prev != curr)
            {
                ++count;
            }
        }
        sVal = static_cast<ScalarType>(count);
    }
    break;
Re: how to achieve xray style orthoimages
So it was quite some time that I wanted to play with this idea.
I took a stab at it in the 'Rasterize' tool which is indeed the easiest way to do it for now.
I added a 'X-ray' option to the existing 'Hillshade' tab at the bottom left of the Rasterize tool window (now called 'Hillshade / X-ray').
It will create a scalar field with the accumulation value. You can then export the grid as a cloud if you want more rendering options (tweak the color scale, use the 'Display > Render to file' option, etc.).
You can test this in the latest 2.14.alpha version for Windows
I took a stab at it in the 'Rasterize' tool which is indeed the easiest way to do it for now.
I added a 'X-ray' option to the existing 'Hillshade' tab at the bottom left of the Rasterize tool window (now called 'Hillshade / X-ray').
It will create a scalar field with the accumulation value. You can then export the grid as a cloud if you want more rendering options (tweak the color scale, use the 'Display > Render to file' option, etc.).
- cc_rasterize_xray.jpg (315.09 KiB) Viewed 59618 times
Daniel, CloudCompare admin
Re: how to achieve xray style orthoimages
Daniel,
great - thanks for putting this xray feature in the next release / current beta.
I did grab the latest code and managed to get the xray view coming up in the preview in Raster dialog...
and it says its generated a new scalar field xray ..
BUT, I didnt seem to be able to save that as an image ?
g
great - thanks for putting this xray feature in the next release / current beta.
I did grab the latest code and managed to get the xray view coming up in the preview in Raster dialog...
and it says its generated a new scalar field xray ..
BUT, I didnt seem to be able to save that as an image ?
g
Re: how to achieve xray style orthoimages
ok.. so it generates a new cloud with the xray 'height' .. then you rasterize that new cloud to get the ortho-image ?
That seemed to give the desired output.
That seemed to give the desired output.
Re: how to achieve xray style orthoimages
Hi there, just discovered the X-ray tool introduced in this PR, nice one! It could be useful to add a quick reference in the doc just so users know it exists without having to test the raster projection tool.
The way we achieved such an xray result in the past was simply exporting the density (population per cell), and either style the scalar field (ptc exported) within CC scalar field editor, or for finer control, import into QGIS and edit Symbology. Using Qgis is also useful to apply image processing like Laplacian, to better handle multi-resolution pointclouds.
My understanding looking at the current implementation is that the grid XY cell-width is used to make a voxel 3d-grid (extending in the projection direction), with one layer spanning each cell width. The projection therefore only accounts for one layer for density higher than that that cell-width, which is a nice idea. The saturation = mu + 2.5 * sigma is also a nice found default.
Just for reference, this method might not be enough for pointclouds with disparate resolutions (like merging focus photogrammetric 3D scan 5mm low area, with landcape 5cm GSD). What we did to tackle such Xrays was first-pass, compute a somewhat accurate density estimate (counting points in neighborhood, hierarchically, at various scales, and computing first meaningful surface density), and then aggregate an inverse function of this density. This is heavier, but once the densities are computed, this might be done similar to how you do it now. Nice to see this land within CC anyway, congrats as always!
Re: how to achieve xray style orthoimages
Good point, I've added something to the 'Rasterize' tool wiki (https://www.cloudcompare.org/doc/wiki/i ... de_/_X-ray).
(I also fixed the nice typo on the line pointed by your link to the code :-D).
And the good thing about the automatic saturation is that it's only the default Scalar Field display saturation value, so the user can change it manually after exporting the cloud.
(I also fixed the nice typo on the line pointed by your link to the code :-D).
And the good thing about the automatic saturation is that it's only the default Scalar Field display saturation value, so the user can change it manually after exporting the cloud.
Daniel, CloudCompare admin